About the Business Intelligence interface
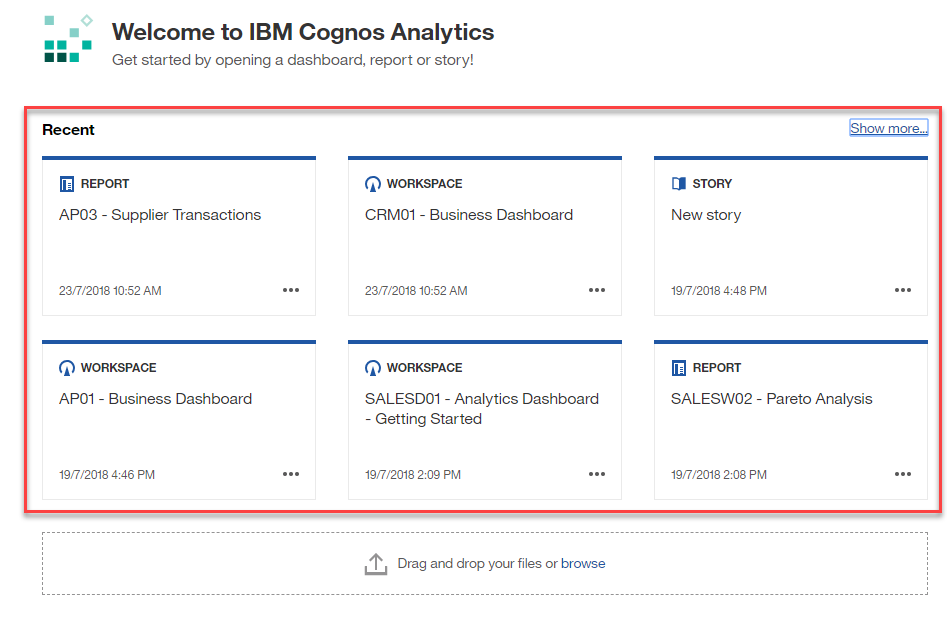
When you first sign in to your pxiPronto Xi Business IntelligenceBusiness Intelligence, often referred to as BI, refers to the skills, processes, technologies, applications and practices used to support decision making. This is also the name of the Pronto Xi BI module. / Cognos Analytics interface, either via the URL or pxiPronto Xi, you will be greeted by the Welcome portal page. The Welcome portal provides a centralised home page from which you can perform all of your Business Intelligence tasks and access all of the reportA set of data deliberately laid out to communicate business information. Depending on the context, 'report' may refer to report specification or report output. Report (more precisely, report specification) is the generic term for the objects created or edited in Cognos Analytics. Pronto Xi Business Intelligence offers a suite of standard reports., dashboardA web page that can contain one or more widgets that graphically represent business data., story, and data module tools.
Here are the key areas of the pxiPronto Xi Business Intelligence interface that will help you get started. Click each numbered area in the headings below to read a quick overview about each part of the main interface.
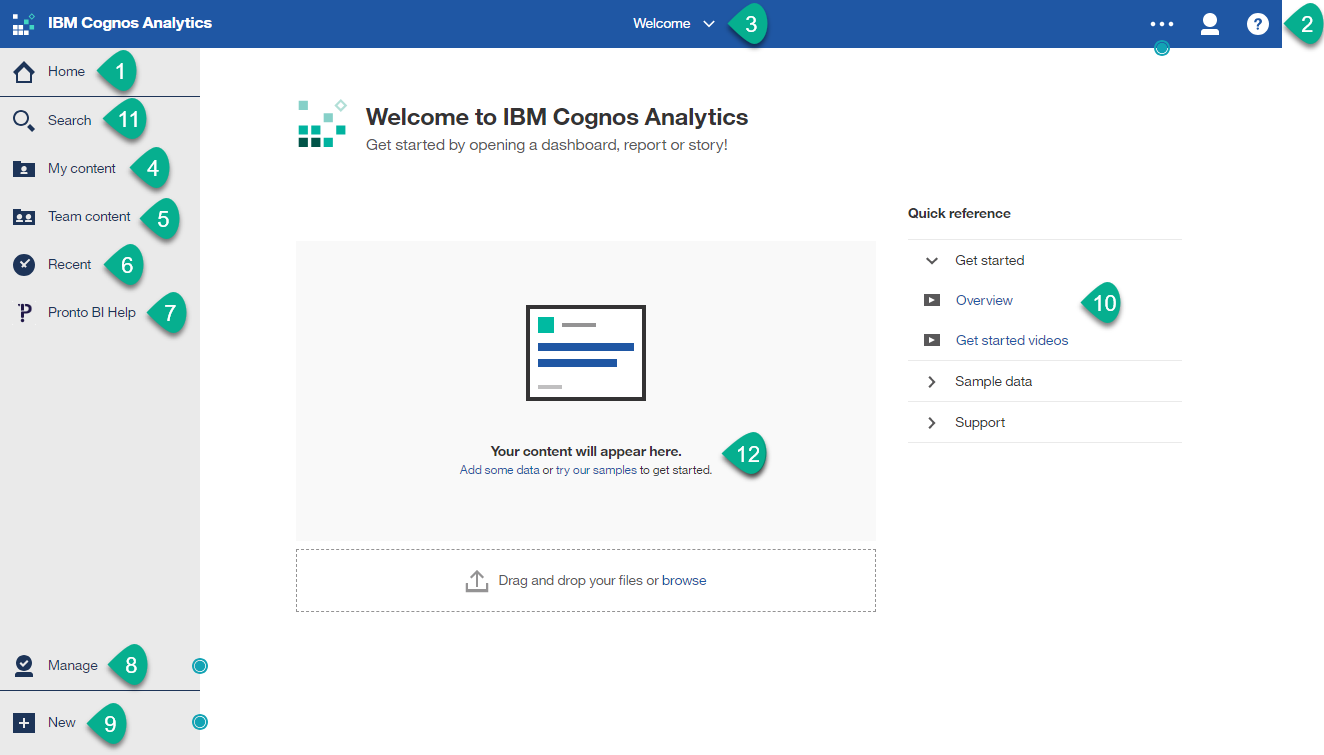

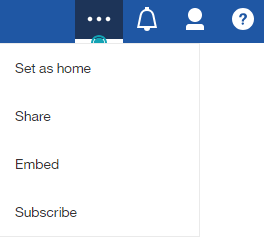
In the top navigation page, you can click the ![]() more,
more,![]() userA person accessing a Pronto Xi Business Intelligence application., and
userA person accessing a Pronto Xi Business Intelligence application., and![]() help icons:
help icons:

-
Set as home
You can set your home page as any report, dashboard, or story by clicking Set as home in the top right Navigation pane.
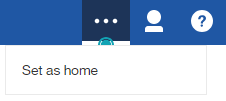
To clear this selection, you simply select another page as your home page.
-
Share
You can copy the link of the page you are on to share it with other users.
For more information, see Embed your content into a web page.
-
Embed
You can get the code to allow you to embed your content objects into customised web pages.
For more information, see Embed your content into a web page.
-
Subscribe
If you use a report regularly, you can subscribe to it. When you subscribe to a report, the subscription includes all your prompt and parameter values. When you subscribe, you pick the time, date, format, and where you want it delivered.
![]()
The user options allow you to sign in and out of Business Intelligence, setA selection of members in a dimension your interface preferences, and view and manage your schedules, subscriptions, Inbox, and watch items.
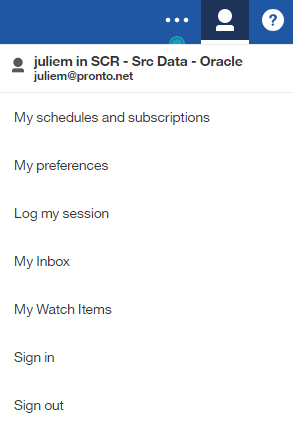
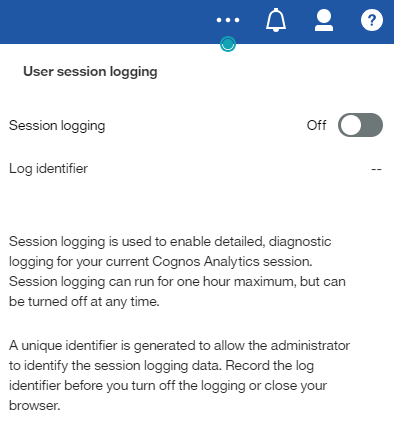
You can also turn on sessionA period during which an authenticated user is logged on to Pronto Xi Business Intelligence. A user may operate in multiple sessions at the same time. logging by clicking Log my session.
![]()
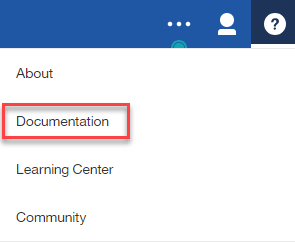
In the help drop down, click Documentation to open the IBM Cognos Analytics help.


You can save and organise your items in My content, which is useful for saving report views with your custom prompts or for saving report outputReport output combines data at the point in time when the report was run. versions. If you are a report author, you can also create your own report, dashboard, story, or other content in Cognos Analytics and save it to your My content folder.
Your My content folder is your private area and only you can see the content that's stored there.
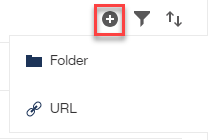
You can add your own folder structure and add URL links to other content by clicking the New button.

Your Team content folder holds the content available to you and others in your team or organisation. Depending on your permissions, you might be also able to add or maintain content and folders in here.
The Team content folder holds all the standard pxiPronto Xi Business Intelligence content including reports, dashboards, KPIs, drill through reports, and packages.
For more information about this content, see About Pronto Xi Business Intelligence content and Finding the standard reports and dashboards.
![]()
Business Intelligence administrators have access to administration functionality using the Manage tab.
For more information, see Cognos Analytics administration.
You can create new content and jobs using the New button.
The content types you can see will depend on the permissions your administrator has set up for you.
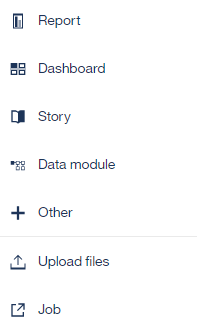
-
Report
Add a new report using the Report tool.
For more information, see About the BI Report tool and Getting started in IBM Cognos Analytics - Reporting in the Cognos Analytics help.
-
Dashboard
Create a new dashboard.
A dashboard helps you to monitor events or activities at a glance by providing key insights and analysisA process where a user interacts with data to gain insight and understanding. about your data on one or more pages or screens. You can explore the data that is shown in a visualisation by using the interactive title, drilling up or down columns, and viewing the details of a data point.
For more information, see Dashboards and stories and Get started with Dashboards and Stories in the Cognos Analytics help.
-
Story
Create a new story.
A story is a type of viewA set of data connected to a cube, deliberately laid out to communicate business information. that contains a set of scenes that are displayed in sequence over time. Types of stories include slide show and guided journey.
Stories are similar to dashboards because they also use visualisations to share your insights. Stories differ from dashboards because they provide an over-time narrative and can convey a conclusion or recommendation.
For more information, see Stories, Dashboards and stories, and Get started with Dashboards and Stories in the Cognos Analytics help.
-
Other
Create a new drill throughThe act of navigating from a summarised data report to a more detailed report. definition, or add a new workspace, using the legacy Cognos Workspace application.
Cognos Workspace will be opened in a new window.
-
Data module
Create a new data module.
-
Upload files
If you want to do some quick analysis and visualisations with data files, you can upload them to Cognos Analytics yourself and use them in dashboards and stories. Uploaded files are also used as sources for data modules.
For more information, see Uploading data in the Cognos Analytics help.
-
Job
Add a new jobA group of runnable objects, such as reports, agents, and other jobs that you run and schedule as a batch., which allows you to set the same schedule for multiple entries. A job identifies a collection of reports, report views, and other jobs that are scheduled together and share the same schedule settings. When a scheduled job runs, all the entries in the job run.
For more information about jobs, see Using jobs to schedule multiple entries in the Cognos Analytics help.
You can find reports, dashboards, stories, data, files, folders, packages and other items by opening your My content or Team content folders or by checking your Recent list. But Search is a quick, easy way to find your items.
To find items, type keywords and press Enter, or select a suggestion from the list that will appear as you type.
You can also search for text including table or column labels, XML report specifications, URL items, shortcuts, templates, and more. Search doesn't return results for content that's archived, but you can access archived content from a report that's listed in one of your folders.
For more information, see Search and find content in the Cognos Analytics help.